Assets
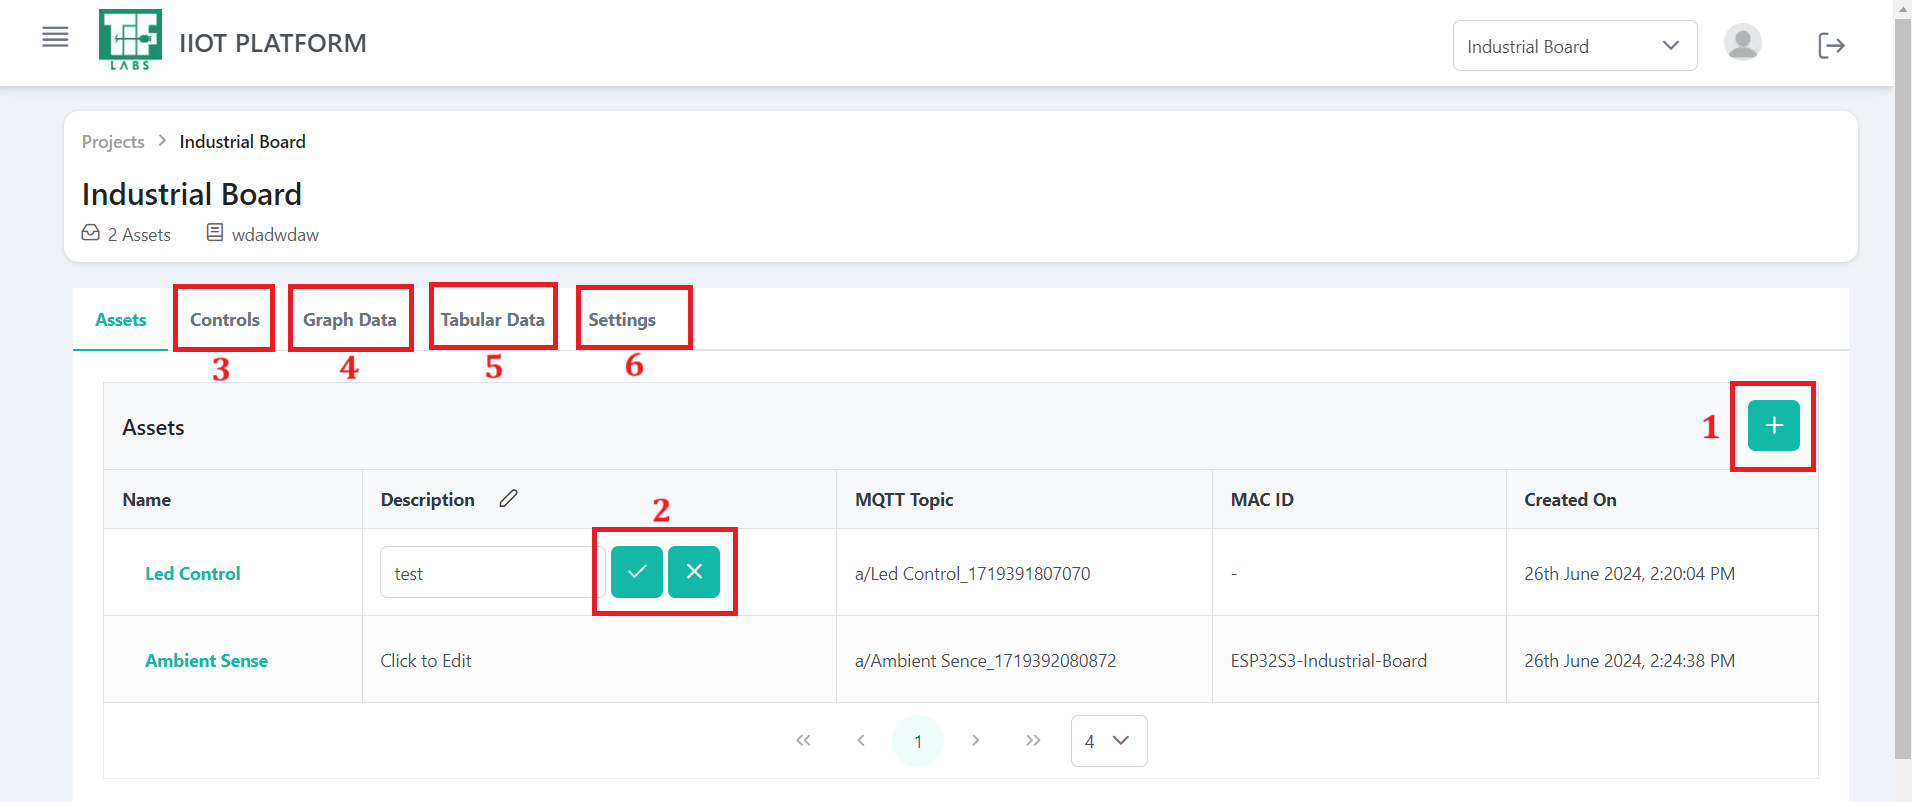
Fig 1.14 Asset Page after creation
The figure 1.14 above shows various sections of the Assets page. Each section will be explained in detail below.
1. Create a New Asset
This option enables you to create new assets, each representing individual nodes or devices within a project that require separate data monitoring.
!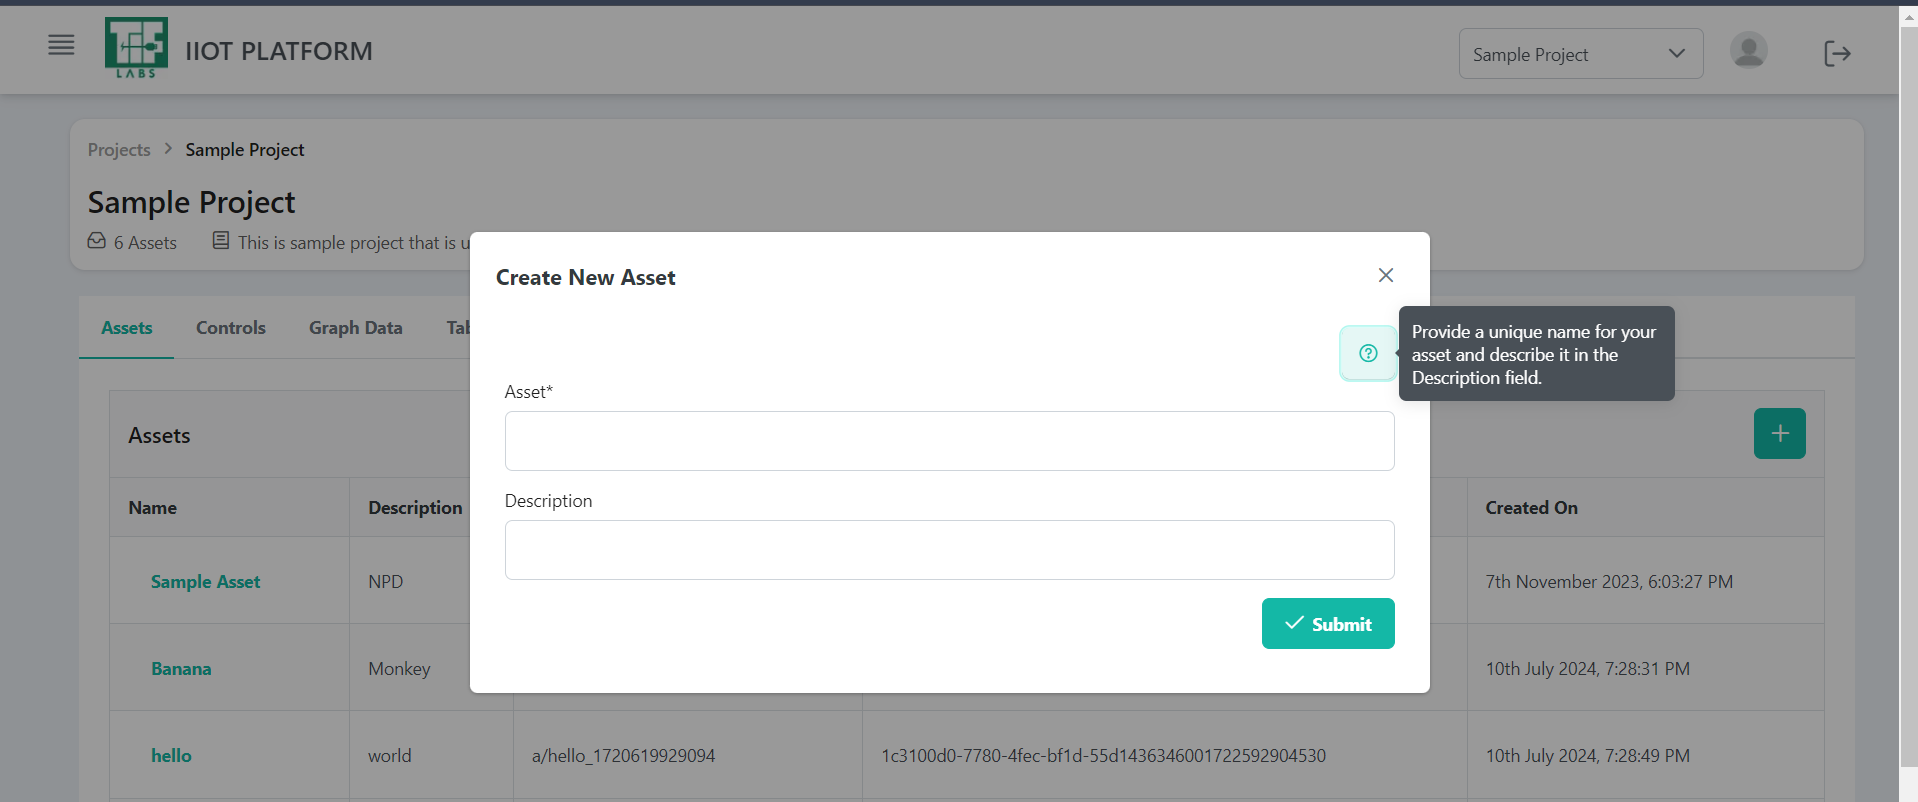
Fig 1.15 New Asset Creation
2. Edit the Asset Description
To edit an asset's description, click on the text you want to modify. An editable text box will appear. After making changes, click the checkmark icon or press 'Enter' to save. A confirmation message will confirm that the description has been updated. If you cancel the action, no changes will be saved.
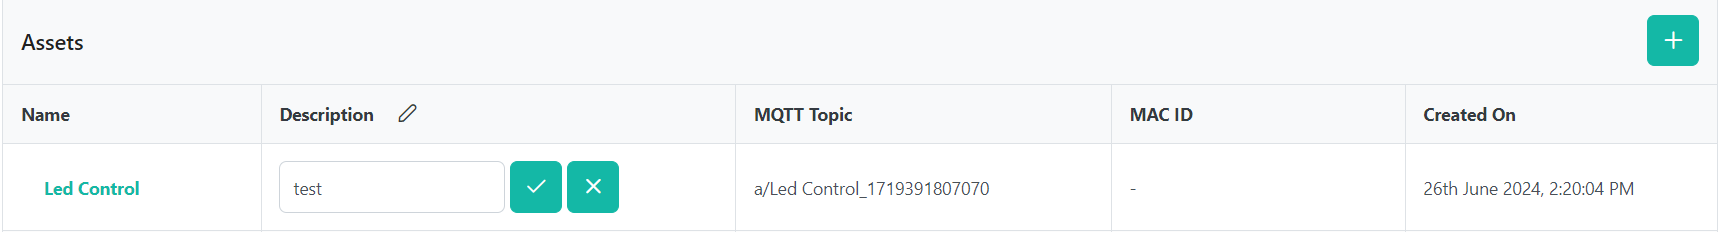
Fig 1.16 Editing asset description
3. Controls
The Controls page provides the capability to manage and interact with various assets and components connected via GPIO pins. It offers real-time control and feedback through live updates, with each component being assigned a specific GPIO pin for control and monitoring.
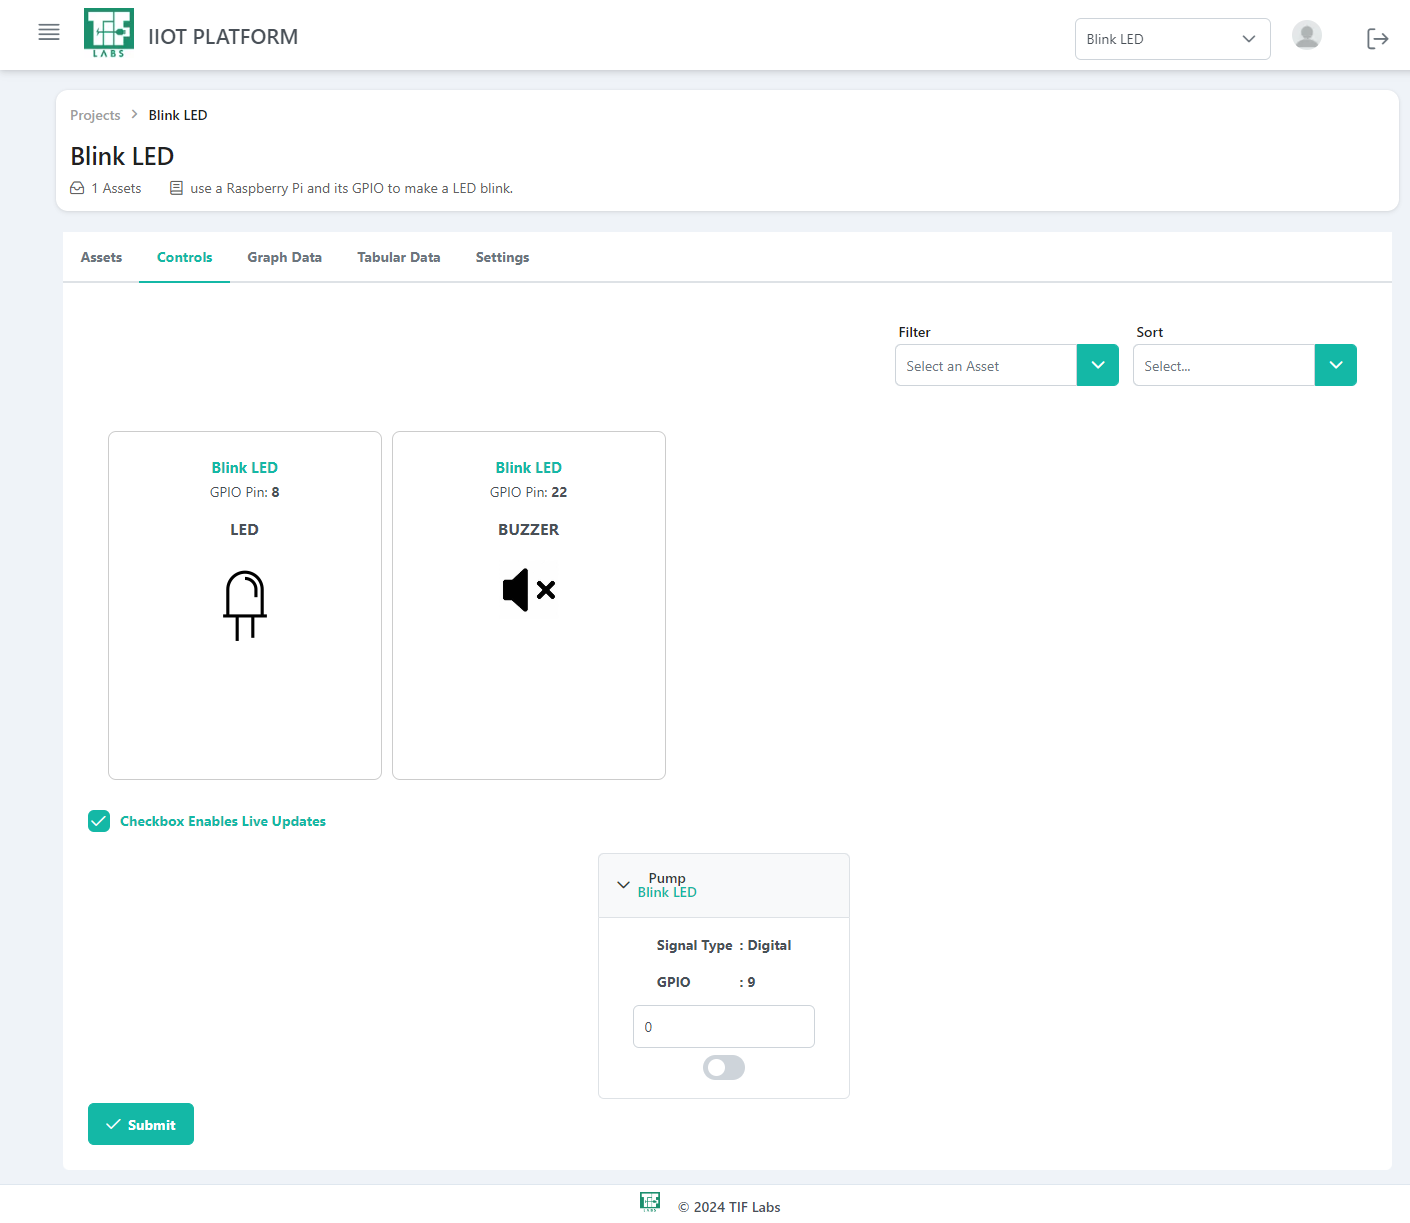
Fig 1.17 Controls Page
Key Features:
- Asset Management: Manage multiple assets, each associated with specific GPIO pins.
- Component Control: Interact with various components (such as e.g., "LCD Display", "LED Light", and "Buzzer") through dedicated input fields and controls.
- Filter Options: Filter parameters based on assets within a specific project.
- Sort Functionality: Sort assets by signal type or alphabetically, enhancing navigation and organization within the controls.
4. Graph Data
To view a graphical representation of the stored data, click on the Graph Data tab.
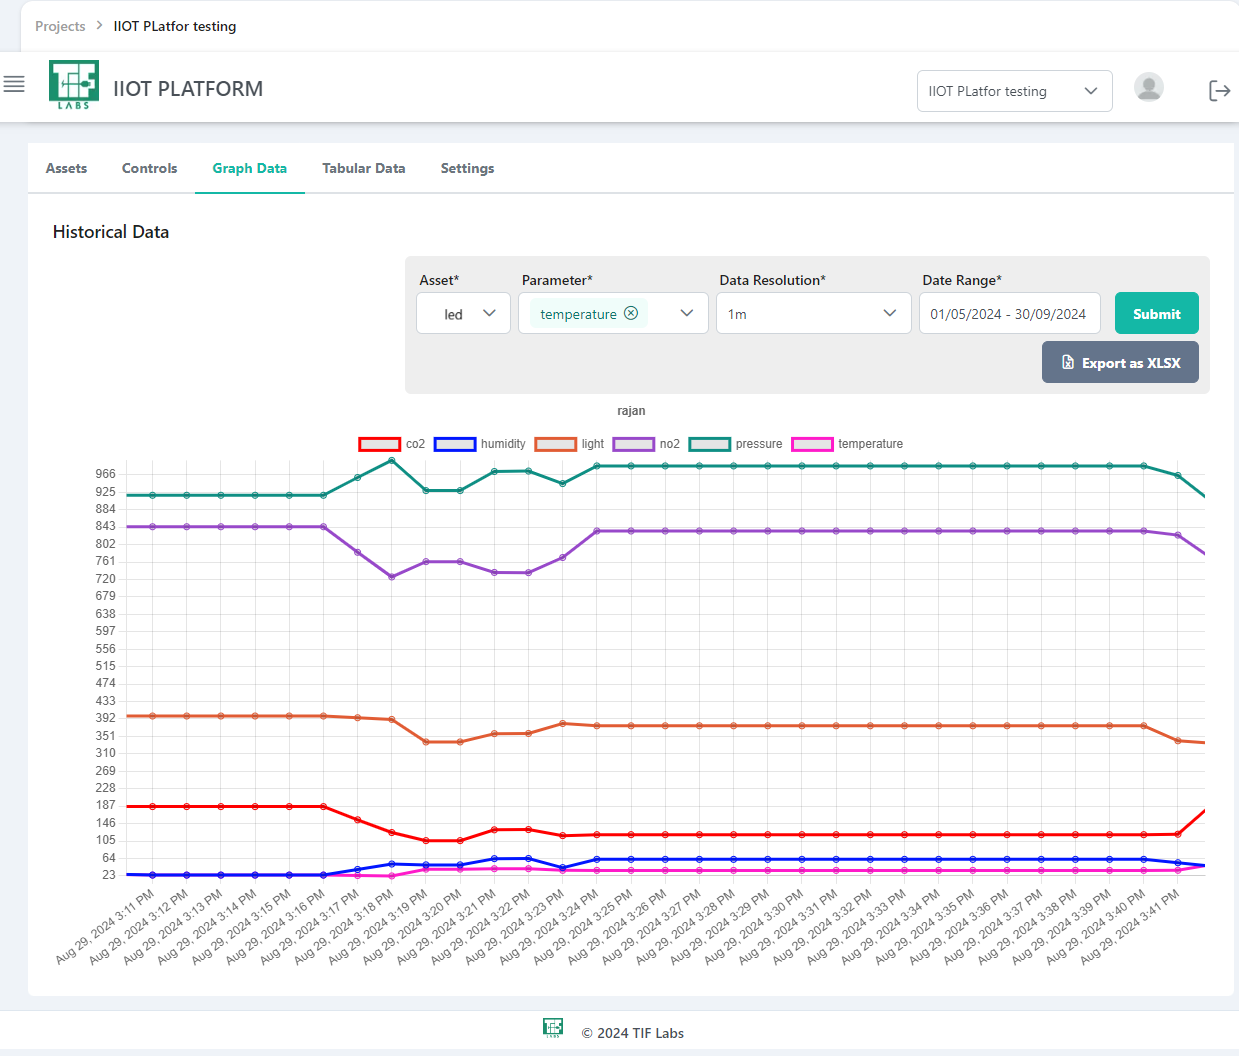
Fig 1.18 Graphical Data Page
- Asset: The user can select an asset from the available options within the project. This allows for focused data visualization on specific devices or nodes.
- Parameters: Users can select more than one parameter to display on the graph. This feature enables comparative analysis, allowing the visualization of different data sets (e.g., temperature and humidity) on the same graph.
- Data Resolution: Data resolution refers to the granularity of the data points displayed on the graph. Users can specify the interval for data points, such as 1 Minute,5 Minutes, 1 Hour, 24 Hours
- Date Range: This refers to the time frame for which the user wants to visualize the data. Users need to specify the interval to see the graph, allowing for tailored analysis over specific periods.
Exporting Data:
An Export option allows users to download the displayed data in Excel format. This feature facilitates offline analysis and reporting. When clicked, an Excel file containing the selected parameters and time frame will be generated, making it easy to share and review the data outside the platform.
5. Tabular Data
In this section, you can view the collected data in a tabular format. Each row in the table displays the average data collected during the specified period, providing a concise overview of data.
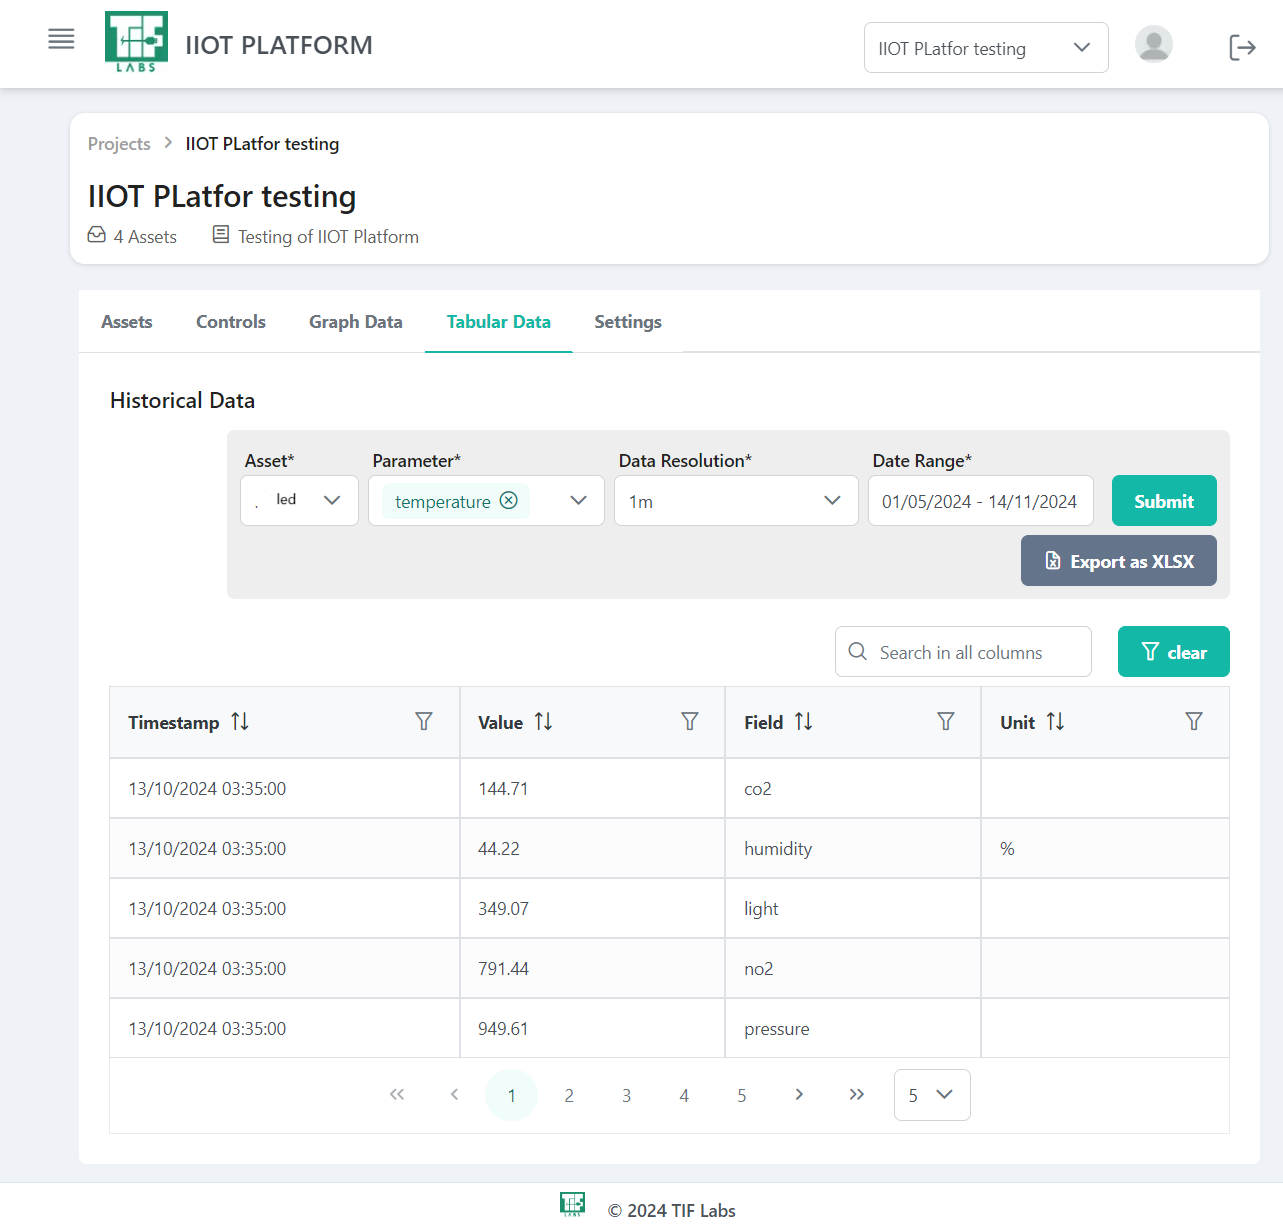
Fig 1.19 Tabular Data Page
This structured format allows for easy analysis of data over time, facilitating quick insights into the performance and behavior of various assets. The table includes relevant parameters such as:
- Timestamp: Indicates the date and time when the data was collected.
- Values: Displays the average values for each parameter over the specified interval.
- Field: Refers to the parameters associated with the asset.
- Unit: Indicates the respective unit of the parameters.
Exporting Data
An Export option is available, allowing you to download the displayed data in Excel format. This feature facilitates offline analysis and reporting. When clicked, an Excel file containing the selected parameters and time frame will be generated, making it easy to share and review the data outside the platform.
Filter Options
The filter options enable users to refine the data displayed in the table. Users can filter by specific parameters or date ranges, ensuring that only relevant data is shown. This functionality helps to focus on particular metrics or periods of interest, enhancing the analysis experience.
6. Settings
To access the username and password for our MQTT broker, navigate to the Settings tab. Here, you can generate a new token or copy the current token.
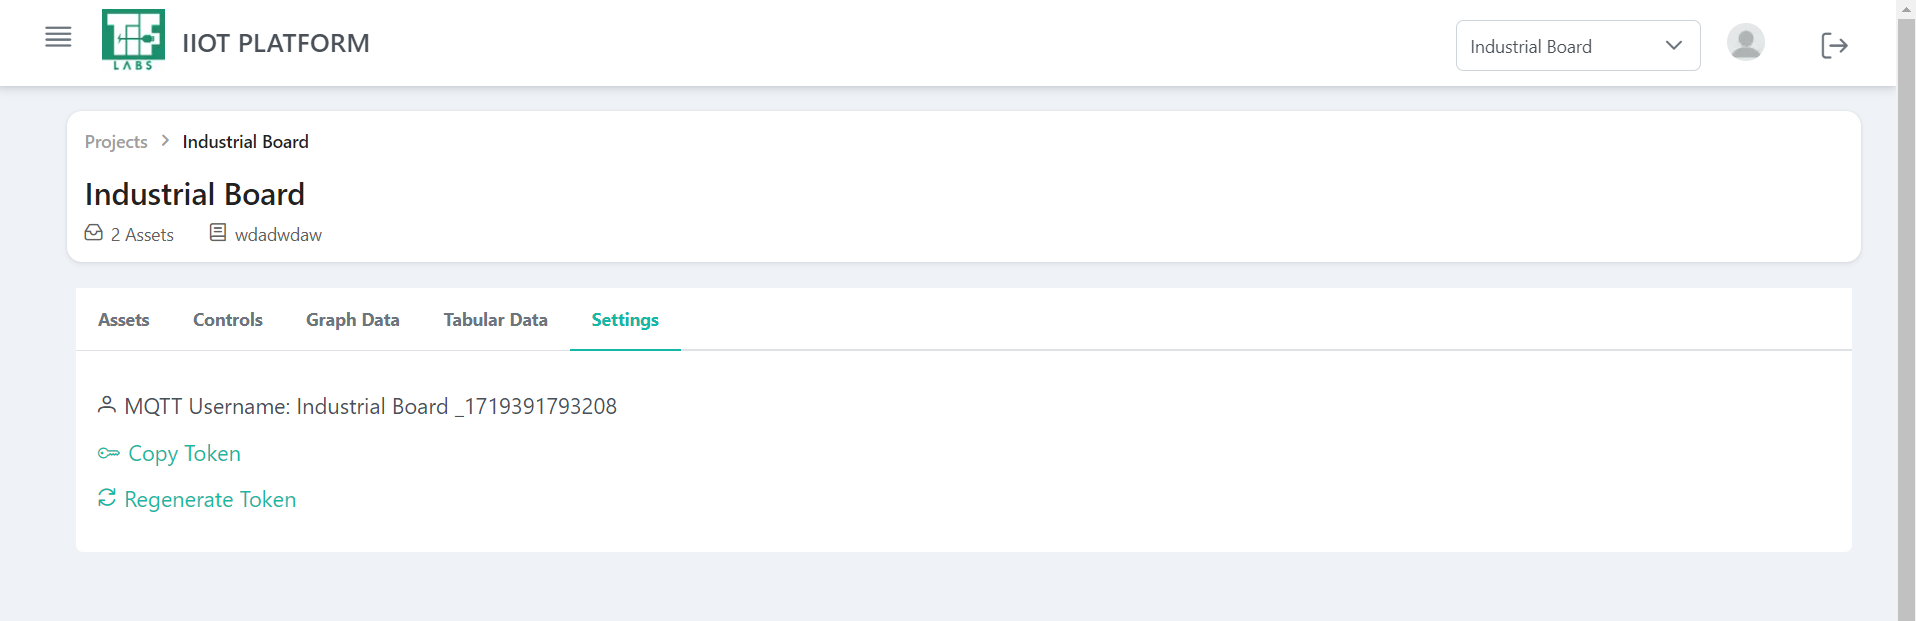
Fig 1.20 Settings Page
Regenerate Token:
This option allows you to replace the current token with a new one. A dialog box will prompt you for confirmation before regenerating the password.
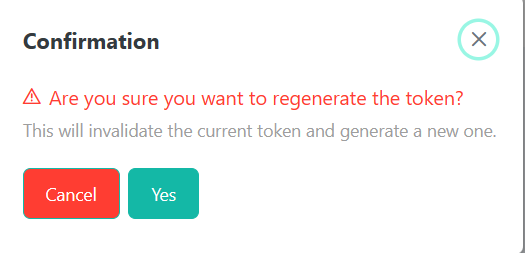
Fig 1.21 Token Regeneration Page