Demonstration
1. To access MQTT credentials , simply click on the settings inside the project tab. From there, you can copy your MQTT Username & Token which refers to your MQTT Password.
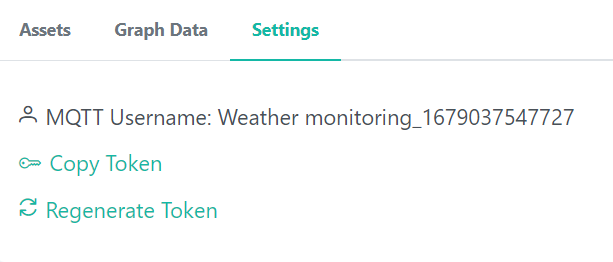
Fig 3.1 Mqtt Username and Password Section
Figure 9: Username and Password access
2. Go to Arduino IDE to code your application.
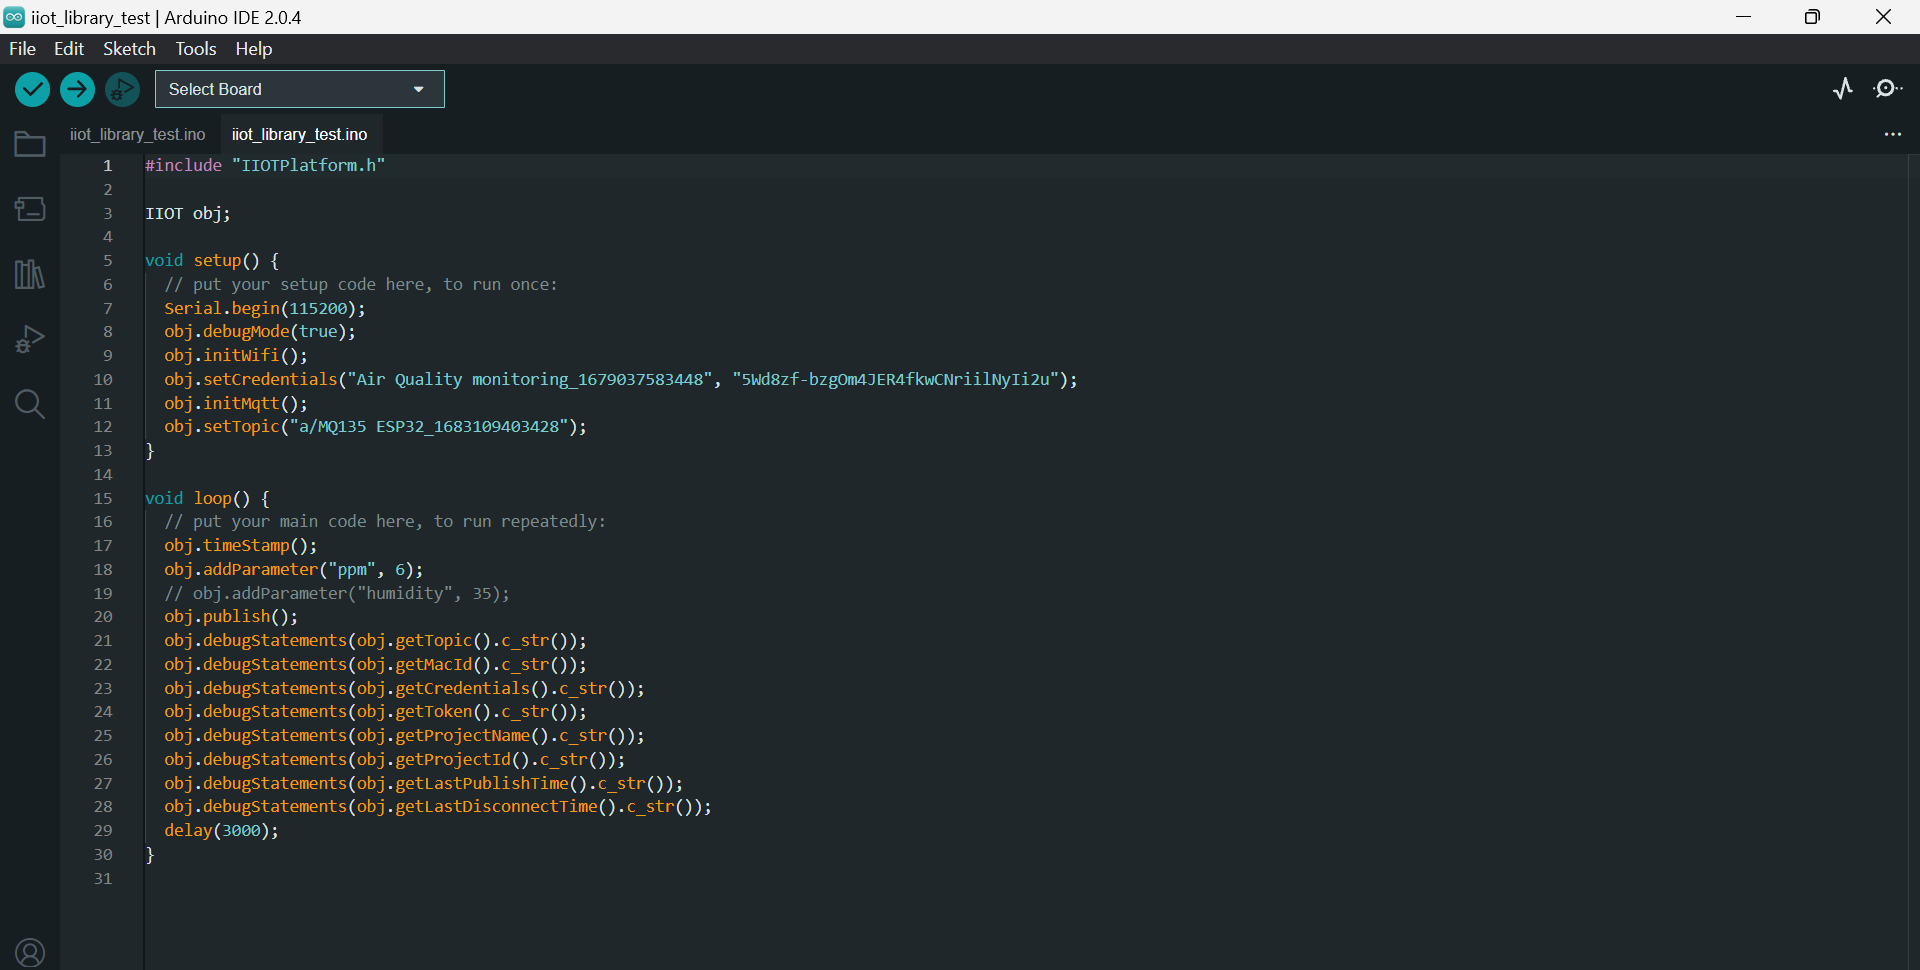
Fig 3.2 Arduino Ide Interface
#include "IIOTPlatform.h"
#include <DHT.h>

IIOT obj;

#define DHTPIN 13 // Digital pin connected to the DHT sensor
#define DHTTYPE DHT22 //DHT sensor type
DHT dht(DHTPIN, DHTTYPE);


void setup() {
  Serial.begin(115200);
  obj.debugMode(true);
  obj.initWifi();
  obj.setCredentials("sample project_1684153030382", "xutq4HQLxI-dB26pbBGopctRZB_jeCuT");
  obj.initMqtt();
  obj.setTopic("a/simple assets_1684153070346");
  dht.begin();
}

void loop() {
  delay(2000); // Wait for 2 seconds between readings
  float humidity = dht.readHumidity();//temperature reading
  float temperature = dht.readTemperature();  //humidity reading

  if (isnan(humidity) || isnan(temperature)) {
    Serial.println("Failed to read from DHT sensor!");
    return;
    }

    obj.addParameter("temperature", temperature);
    obj.addParameter("humidity", humidity);
    obj.publish();

    Serial.print("Humidity: ");
    Serial.print(humidity);
    Serial.print("% Temperature: ");
    Serial.print(temperature);
    Serial.println("°C");
}
Connections:
3. Connect DHT11 sensor pins to ESP32 as per given below table respectively.
Table 1: connection details
| Raspberry Pi | DHT11 |
|---|---|
| GND | GND |
| 3.3 V | VCC |
| PIN 4 | DATA PIN |
4. Include the necessary code file and library functions. (DHT11 in this case)
a.Install DHT11 library:
Download the library file from the link:
https://github.com/adafruit/DHT-sensor-library
Add zip library in Arduino IDE.
5. After the above steps, click on the verify button to execute the program.
6. After verification of program click on Upload to upload the program.
7. Let the program run for a considerable amount of time so that will be able to view some volume of data on the website.
A sample set of readings stored on the website is shown below in graphical format:
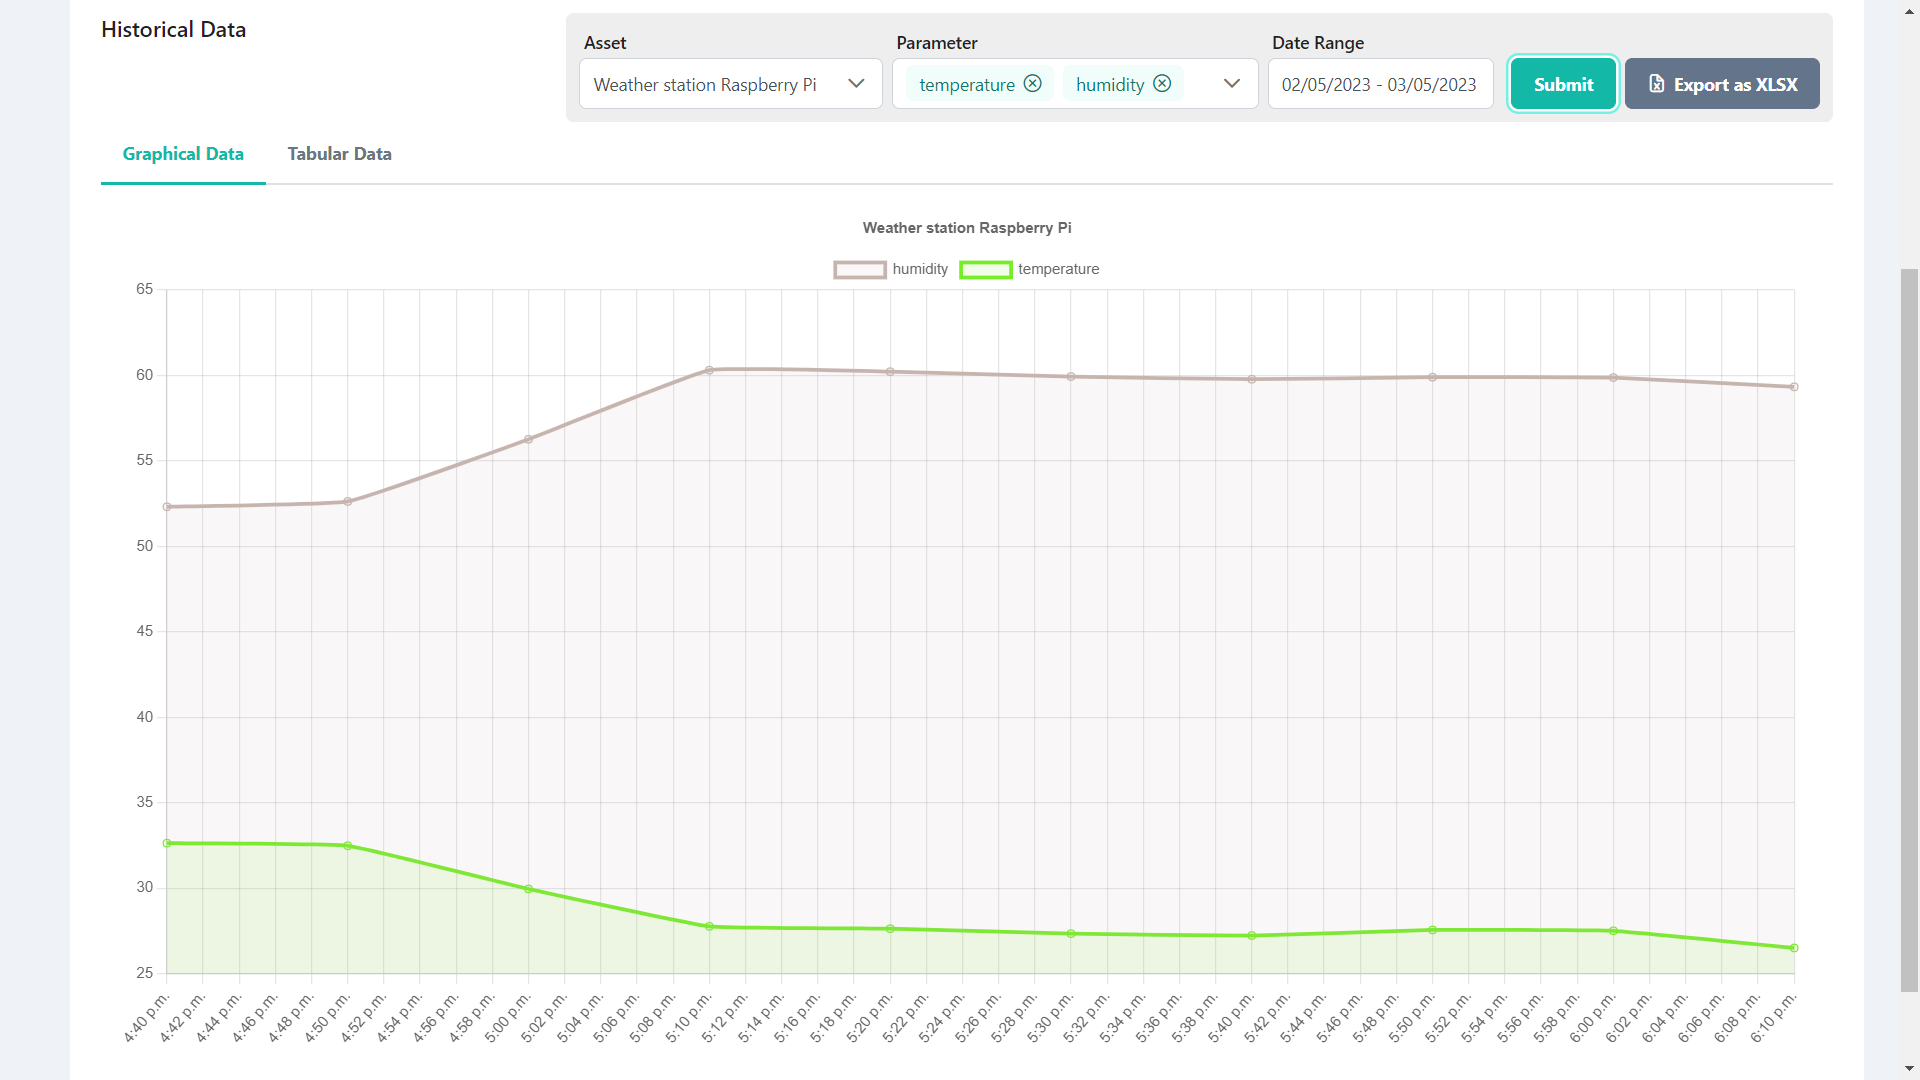
Fig 3.3 Data Visualization Dashboard